Plotalot
Plotalot makes it easy to create live charts and place them on your site. You must be able to write the SQL queries to retrieve the data you want to plot, but if you can do that, Plotalot will take the data and use the Google Charts API to produce charts or tables of your data. (Various SQL builders are available that you may find helpful if you are not confident creating SQL, or we can provide a service to develop custom SQL for you).
You can create menu items that display charts on your website, or you can use the Plotalot Plugin to include as many charts as you like in any article, simply by writing {plotalot id="xxx"} anywhere in the article. The Plotalot plugin will replace any number of {plotalot} tags with an image or table, as defined by the chart definition.
One way to display the output from Plotalot is to create a custom module and enter any text you want, along with the code for the Plotalot item. Don't forget that modules can be created on the admin side, as well as the user side. So you can use Plotalot to create charts and tables in the administrator control panel.
For the best results, consider upgrading your subscription and installing the Plotalot Pro plugin.
Some of Plotalot's features are:
- Numerous chart types, with numerous options
- Charts can dynamically responsive, for example changing size when a device is rotated
- Charts can dynamically refresh without re-drawing the entire page.
- Simple tables, Google Charts tables, or single items of text
- Titles and axis labels can be simple text or SQL queries
- Axis limits can be automatic or specified by numbers or SQL queries
- Query the local site database or any supported external database
- No libraries to install, just a component and a plugin
- Show charts on your site front end using a simple menu item, or using the Plotalot article plugin
- Self contained charting class can be built in to your own components (front end or back end)
- The Plotalot Plugin can cache charts to reduce database load and improve performance
- Charts can be fully responsive
- Charts can automatically refresh using Ajax, i.e. without redrawing the whole page
From a recent review at JED:
As a long-time Joomla developer, I’ve tested numerous charting components, but Plotalot stands out as the most intuitive and powerful solution for data visualization. I’ve successfully used Plotalot created dynamic charts for academic projects.
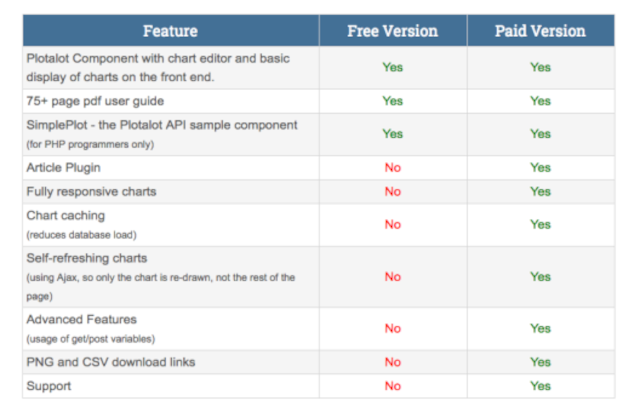
You can enable the Pro features of Plotalot by installing the Plotalot Pro plugin. The feature comparison is:
 Plotalot was created by Chris of Les Arbres Design.
Unfortunately, Chris has withdrawn from software development because of ill health. In order to give Plotalot a healthy future, it is now being supported and developed here.
using option refresh="30" does not seem to work in content plugin via google table